Blog
Does Fund Size Matter?
Oct 03, 2012
“Big VC funds fail to deliver big returns. We have no funds in our portfolio that have raised more than $500m and returned more than 2x our capital after fees.” Kauffman Foundation, 2012
“Small funds have a better performance profile than large funds.” Silicon Valley Bank, 2009
Many smart venture capital observers have lamented the emergence of VC "megafunds." Yet the trend over the past decade has been unmistakable: even as new limited partner (LP) commitments to the overall VC market have contracted, LPs have concentrated ever more capital among fewer firms with larger funds. Indeed, the ten largest VC firms have raised 34% of total industry commitments since 2008 according Dow Jones VentureSource (Figure 1). This is twice the equivalent concentration measure for 2000-2003. How can the LPs be so mistaken if the superiority of small funds is so obvious?

Venture Capital performance data can be noisy and difficult to come by so people tend to analyze that which is easily available. But I contend that this has resulted in some very misleading conventional wisdom about fund size. In particular, the critics of larger VC funds have often fallen into one or more of the following traps:
(1) They focus on easy to describe, yet less relevant measures of performance
(2) They fail to adequately control for changes in industry structure and performance over time
(3) They implicitly confuse arguments against too much aggregate capital in the industry with those regarding the optimal distribution of that capital among funds
(4) They place too much importance on “fund size” as a critical variable
I do not claim to have the definitive answer. Indeed, I’m hampered by many of the same data scarcity problems as others. That said, after correcting for the factors above, the data call into question the conventional wisdom that small funds are inherently superior. Indeed, the data suggest just the reverse: over the past 30 years larger funds have enjoyed a modest but consistent advantage over their smaller peers.
Are We Asking the Right Questions?
“Turning $150 million into $450 million is a lot easier than turning $2.5 billion into $7.5 billion.” Bob Ackerman, Allegis Capital, in 2010 Businessweek article
Mr. Ackerman’s statement is probably true. Examining all VC funds in the ThomsonOne database raised between 1980 and 2005 shows that just 3.2% of funds larger than $500M have returned >3x to date while 11.8% of funds smaller than $500M have.
But the statement is also not particularly relevant. Let’s put this in perspective: Imagine if your retirement advisor came to you last week and said, “I’ve been crunching the numbers and those suckers at Vanguard have it all wrong. Over the past 18 months, 6% of unprofitable microcap companies with valuations less than $200M have returned more than 2x. But not a single profitable company larger than $20B has. Those large caps are underperforming. We need to get all your savings out of Apple and Exxon and into unprofitable microcaps immediately!” His numbers are precisely correct. But I suspect you’d be more than a little uneasy.
As well you should, because investors don’t invest in single assets, they invest in diversified portfolios. And they don’t measure return by the percentage of individual assets meeting an arbitrary return threshold, they seek out the best risk-adjusted average return across the complete portfolio. As it turns out, despite the far better chance of earning >2x with individual unprofitable microcaps, the megacap portfolio was up 23% over this period vs. 17% for the microcaps.
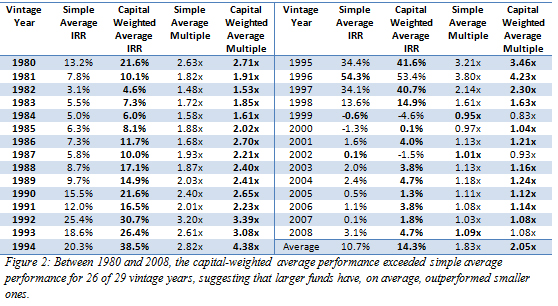
So what does an aggregate view of VC industry data show? Figure 2 lists the simple average (i.e., all funds are equally weighted regardless of size) and capital-weighted average performance from each vintage year for funds listed in the ThomsonOne database. By definition, the capital-weighted average for each year places proportionately greater weight on larger funds and proportionately lesser weight on smaller ones. Therefore, if it were true that smaller funds, on average, outperformed larger ones, it would also have to be true that the simple averages would exceed the capital-weighted averages. Quite the opposite. In 26 of the 29 years examined, the capital weighted averages were better both on an IRR and cash-on-cash multiple basis. In other words, in most vintage years larger funds have, on average, outperformed smaller ones.
The situation is similar to our retirement advisor’s mistake. Smaller funds are often, by design, less diversified. They usually contain fewer portfolio companies and often specialize in a stage, industry, or geography. While this enables focused investment professionals, it also necessarily increases volatility of those funds. Now, this volatility is not in itself bad – LPs are perfectly capable of diversifying their own portfolios by investing in multiple, focused funds with different strategies – but it does explain the disconnect between the data described in Figure 2 and the fact that funds smaller than $500M have historically had a higher likelihood of exceeding a 3x return. Smaller, less-diversified funds are more volatile so their returns are more spread out toward the extremes, with a greater number having either very good or very poor performance.
The “Switch Hitter Problem”
A second factor that can mislead VC analysts is the inherent challenge in comparing returns across very different time periods. In doing so, it is possible to run into a statistical mistake I like to call the “Switch Hitter Problem." Imagine you are a baseball manager. It is the bottom of the ninth, you have two outs and need a hit to win. You have to choose between two Designated Hitters.
 Batter A has a 0.260 batting average and Batter B a 0.340. Batter B should give you the better chance to win, right? Not so fast. Baseball fans may quickly tell you it depends on whether a righty or lefty is pitching. But, strangely enough, in this case that doesn’t matter either. Batter A is the superior choice against either; his batting averages batting both right handed and left handed are higher. How can his overall average be lower, then? Because the two batters have faced a very different mix of historical right handed and left handed at-bats.
This effect is more common that you may think. It is the reason that most retailers report “same store sales growth” metrics which control for differences in numbers of newly opened vs. mature locations, and the reason that virtually every political poll has been rebalanced to correct for demographic differences between the individual poll’s sample set and those of likely voters.
What does this have to do with VC data? Over the past two decades, the VC market has gone through a massive cycle from tech bubble to bust to [insert your opinion of today’s market here]. The typical fund raised in 1995 did very, very well (55% mean IRR), while the typical fund raised in 1999 did very, very poorly (-4% mean IRR). But no fund raised in 1995 exceeded $750M in size while there were ten such funds in 1999. Thus, if we simply average all data points from both years, the >$750M size group naturally looks terrible since all of its data points are drawn from 1999. But this obfuscates the fact that those ten “megafunds” funds actually outperformed their average 1999 peers. Just as our batters had a very different mix of RH and LH at-bats, the VC “boom years” and “bust years” had very different mixes of fund sizes. How might a >$750M fund have performed within the boom of 1995? We have no way of knowing, of course, since none existed.
It’s All Relative
Each year, LPs need to decide whether the overall VC market is an attractive investment (that is, ideally, they’d like to invest more capital in a year like 1995 than in 1999). But assuming they have decided to invest in a given year, we need a way to compare without falling into the “Switch Hitter” trap to decide how to best allocate those investments.
One obvious way to resolve this issue is to compare the size and performance of funds relative to other funds raised the same year. Indeed, this is exactly what LPs do whenever they talk about “top quartile” performers for each vintage.

Over the last 30 years, the largest funds have been far more likely than their smaller competitors to become top quartile performers. Funds ranking among the 5% largest in their vintage year have been nearly twice as likely to be a top quartile performer as those from the smallest 75% in the same vintage (41% vs. 23%; see Figure 3). Furthermore, funds from this largest group were only about one third as likely (10% vs. 28%) to fall into the bottom performance quartile.
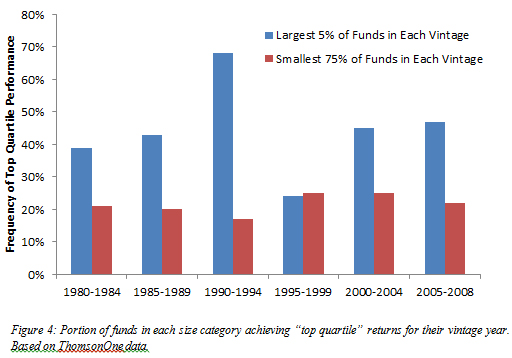
And this large-fund performance advantage has been relatively consistent over time (Figure 4). Only during the tech bubble period of 1995-1999 was the incidence of top-quartile performance similar (24% vs. 25%) between largest 5% and smallest 75% of funds. In all other periods, funds ranking among the 5% largest in each vintage year were significantly more likely to perform in the top quartile than their smaller competitors.
Is this just an artifact of using “IRR top quartile” as our metric of choice? An alternative metric used to analyze fund performance is PME or “Public Market Equivalent” return. PME attempts to control for differences in time periods by comparing fund cashflows to the amount those investments could otherwise have earned if invested in a public equity index. Unfortunately, I do not have access to the quarterly cashflow data necessary to calculate PMEs for the data set analyzed above. However, an analysis from a February 2012 NBER working paper on VC industry returns reports that larger funds are (slightly) advantaged when using other performance metrics:
For VC funds, when we control for vintage year… we find a strong positive relation between size and all three measures of performance [IRR, Multiple, and PME]. Funds in the smallest size quartile significantly underperform funds in the 3rd and 4th size quartiles. Fund performance, however, does not drop off with size. Controlling for vintage year, funds in the [largest] size quartile have the best performance albeit not significantly greater than the performance of the 3rd and even 2nd size quartiles.
For completeness, I should note that other analyses using absolute (i.e., fixed dollar thresholds) rather than relative measures of fund size have found a small drop off in IRR for funds larger than $500M, even when attempting to control for vintage year. However, as noted earlier, very few such funds existed prior to 1999 so it is not clear that these analyses have enough data to speak with much precision on the very largest funds.
Furthermore, relative measures of fund size more accurately reflect the decisions LPs faced when deciding to invest. For example, a well-performing $200M fund raised in the early 1990s would have represented one of the largest funds ever raised up to that point. Yet within an analysis like the Kauffman Foundation’s it would be considered a “small” fund. Would we today call Mark Spitz a “below average Olympic swimmer?" After all, his world-record-breaking 1972 200m Freestyle performance would have placed just 83rd at this year’s U.S Olympic Trials, a full five seconds off from making the team. Indeed, one co-author of a widely referenced absolute fund size analysis showing a decline in performance among funds larger than $500M just raised a $1.6B VC fund, so the findings do not appear to have worried him or his investors too greatly.
An Industry in Flux
All of this is not to say the industry should be completely absolved of its sins. Overall venture returns over the past decade – among funds both large and small – have been dismal. This suggests there has been far too much capital chasing far too few great opportunities. The NBER working paper referenced above formalizes this hypothesis finding “vintage year performance… decreases with the level of aggregate capital…. [and] the magnitudes of these relations have been greater for VC funds [than for buyout funds].”
But the fact that there has been too much aggregate capital does not necessarily mean individual funds are too large. It could equally mean there are simply too many funds. This appears to be the hypothesis of LPs cumulatively. As we saw in Figure 1, overall VC fundraising has been declining over the past decade even as concentration has increased.
Put another way, in a sense the LPs have decided it is less important whether “It is easier to return >2x on a $100M or a $2B fund” than whether “It is easier to return >2x across 600 $100M funds or 30 $2B funds.”
Is “Fund Size” Even a Meaningful Statistic?
One last challenge common across all of these analyses (including my own) is that “fund size” alone doesn’t always accurately reflect the investment practices of a firm. At NEA, we have historically made investments out of a single, diversified fund. Our recently announced NEA 14 fund will be no different, investing across multiple sectors, stages, and geographies out of a single $2.6B pool of capital. We have elected this structure for a variety of reasons I won’t go into here, but many of our competitors have decided for their own strategic reasons to instead raise multiple concurrent funds. For example, during the four years from 2008-2011 NEA raised just one fund, the $2.5B NEA 13. By comparison, Accel Partners, a well-respected firm with whom we often collaborate, raised roughly the same aggregate amount ($2.7B) but split it among eight funds – separating out their Indian, European, Early Stage, and Growth investing activities as well as having multiple sidecar funds that appear to serve the needs of certain strategic LPs. Both structures are perfectly valid. But in every analysis described above, Accel’s returns would be weighted as eight separate “small fund” data points, while NEA’s returns would be counted as just one large fund, despite the similarities in our operations.
Important Caveats
I’ve presented several of pieces of data which call into question the conventional wisdom that small VC funds are inherently superior. But before we get carried away, it is important also to be clear about what these data do not imply:
These data do not suggest the correlation between larger fund sizes and returns is causal. One explanation for the correlations we’ve seen is that firms with the best deal flow and track records tend to be able to raise larger funds. In that case, the performance advantages they enjoy may be owed to their personal networks and not to fund size. Regardless, it does not appear that their larger fund sizes alone are dramatically impairing these firms’ relative performance.
These data do not suggest everyone should go out and raise larger funds. Fund size should be viewed not in isolation, but in the context of the organization and investment strategy. I suspect a $1B internet seed fund would be disaster; while a $50M fund focused on capital-intensive biotech investments might be equally ill-suited to its task. How many professionals does a firm have? How many total concurrent funds are they managing? What sectors, geographies, and stages of investment are they pursuing? All these questions provide the necessary context to really determine whether a firm is biting off more than it can chew.
These data do not suggest there is no limit to fund size. As described above, some studies using absolute fund size have shown a trailing off in performance above $500M. While I believe these analyses have their shortcomings (e.g., small data sets spanning very volatile time periods where the mix of larger and smaller funds is changing) there clearly must be some upper limit. A venture firm usually will not invest in two directly competitive companies, so there is a natural ceiling to the market share of attractive investments any one firm can command. What is this ceiling? Who knows? But today the very largest VC firms will each represent approximately 3% of the market in terms of new VC commitments (a smaller percentage if you include global fundraising) if one assumes a four year horizon for new investment in each fund. This does not feel like an intractable level of concentration.
Conclusion
Every strategy has its tradeoffs. Smaller, focused funds can go extremely deep in one sector, building expertise without the distraction of the next shiny new trend. But larger, multi-stage funds typically maintain greater reserves to continue to support companies through market downturns and have inherently broader networks of relationships – if they can effectively harness the power of them. We view this as our challenge and opportunity at NEA. The limit to fund size is less about arithmetic than it is about effectively managing an organization where not everyone fits around a single table.
